Economics (030)
Class XI (2024-25)
Time Allowed: 3 hours Maximum Marks: 80
General Instructions:
1. This question paper contains two sections: Section A – Micro Economics Section B – Statistics
2. This paper contains 20 Multiple Choice Questions type questions of 1 mark each.
3. This paper contains 4 Short Answer Questions type questions of 3 marks each to be answered in 60 to 80 words.
4. This paper contains 6 Short Answer Questions type questions of 4 marks each to be answered in 80 to 100 words.
5. This paper contains 4 Long Answer Questions type questions of 6 marks each to be answered in 100 to 150 words.
Section A
1. Assertion (A): Rajiv scored 57 in Mathematics, Ravi scored 98 in Statistics, Anita Scored 45 in Economics. The given data is statistical data.
Reason (R): The statistical data needs to be numerical in nature.
a) Both A and R are true and R is the correct explanation of A.
b) Both A and R are true but R is not the correct explanation of A.
c) A is true but R is false.
d) A is false but R is true.
View AnswerAns. d) A is false but R is true.
2. P10 is the index for time
a) 0 on 1
b) 0 on 0
c) I on 1
d) 1 on 0
View AnswerAns. a) 0 on 1
3. Simple correlation is called:
a) Negative
b) Linear correlation
c) Positive
d) Nonlinear correlation
View AnswerAns. b) Linear correlation
4. Find index number for year 2005 taking 2000 as the base year from the following data by simple average of price relative method:
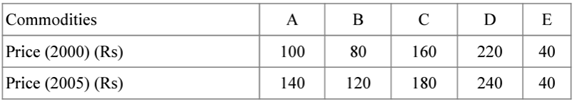
a) 122.2
b) 154.32
c) 121.32
d) 135.32
View AnswerAns. a) 122.2
5. A series of numerical figures which show the relative position is called:
a) Rational number
b) Relative number
c) Index number
d) Absolute Number
View AnswerAns. b) Relative number
6. A consumer price index measures changes in:
a) Consumer prices
b) Wholesale prices
c) Retail prices
d) Producer’s prices
View AnswerAns. c) Retail prices
7. In which process raw material is converted into end products having utility?
a) Exchange
b) Investment
c) Consumption
d) Production
View AnswerAns. d) Production
8. The most common graphical presentation of quantitative data is a
a) pie chart
b) histogram
c) bar graph
d) relative frequency
View AnswerAns. b) histogram
9. Which of the following measures changes in retail price of the commodities?
a) Industrial production index
b) Wholesale Price Index
c) Consumer Price Index
d) Weighted Index
View AnswerAns. c) Consumer Price Index
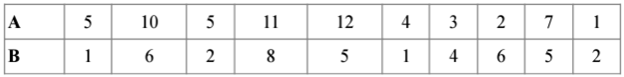
10. Compute the coefficient of correlation of the following score of A and B
a) 0.54
b) 0.52
c) 0.58
d) 0.56
View AnswerAns. c) 0.58
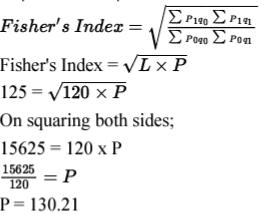
11. For a data Lasperey’s index number is 120 and fisher’s index number is 125. Calculate Paasche’s index number.
Ans.
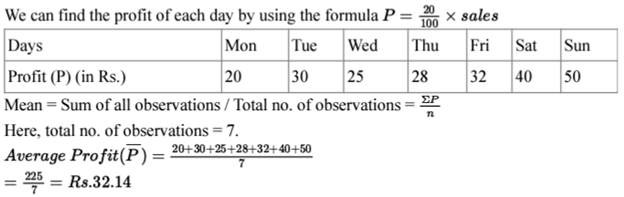
12. The sales of a balloon seller in seven days of a week are as given below.
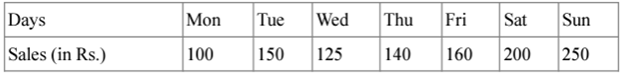
If the profit is 20% of sales, then find his average profit per day.
View AnswerAns.
OR
Find unknown frequency in the table given below.
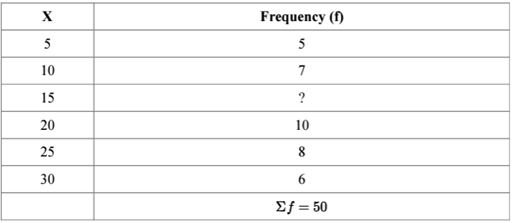
Ans. To find unknown frequency subtract the sum of known frequencies from the sum of total frequencies. Here it is given that the sum of frequencies is 50.

and the known frequencies are 5,7,10,8 and 6.
Sum of known frequency= 5+7+10+8+6=36
Unknown Frequency = Total Frequency-Sum of Known Frequencies =50 – 36=14.
Therefore, the missing frequency is 14.
13. Differentiate between spatial and chronological classification with example.
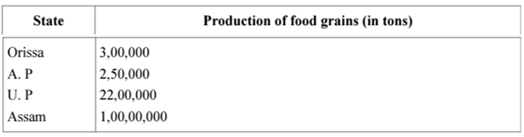
View AnswerAns. Spatial Classification:
In spatial classification, data are classified according to geographical areas.
Example: State wise classification of production of food grains in India: State Production of food grains (in tonnes)
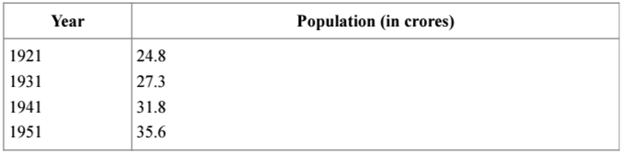
(ii) Chronological classification.
In this type of classification, the data are classified according to different time periods.
Example: Population of India for different time periods.
Profits of a business establishment over different years.
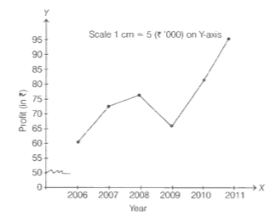
14. Show the annual profit figures of a firm with the help of a time series graph.
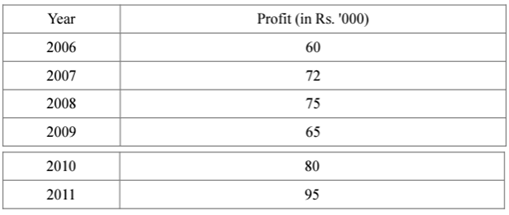
Ans. As per the question, year 2006 to 2011 and their respective profits are given Here, we take profit on the Y- axis and year on the X-axis. Before plotting the graph, we take a false baseline because the profit starts from 60 and there are very small fluctuations in the remaining values of profit, so we take a false base of 50 and then we take the scale as 1 cm = 5 (in thousands). The time series graph of given annual profit figures is shown below:
OR
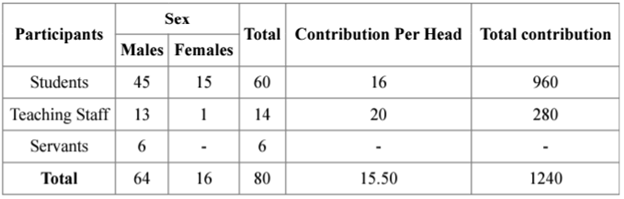
In a trip, organised by a college, there were 80 people, each of whom paid Rs. 15.50 on an average. There were 60 students, each of whom paid Rs. 16. Members of teaching staff were charged at a higher rate, the number of servants (all males) were 6 and they were not charged anything. The number of females were 20% of the total and there was only one female staff member. Tabulate this information.
View AnswerAns. From the information given in the question, we have
Total participants = 80
Number of students = 60
Number of servants = 6
Number of teaching staff = 80 – (60 + 6) = 14
It is given that the number of female teaching staff = 1
Number of male teaching staff = 14 – 1 = 13
It is also given that the number of females is 20% of the total.
Therefore, total number of females = 80 x 20% = (80 x 20) 100 = 16.
Number of female students = 16 – 1 = 15 (since no. of female teaching staff is 1, we deduct that from the total no. of females to get the no. of female students).
Total contribution = 80 x 15.50 = Rs. 1240
Contribution from students = 60 x 16 = Rs. 960
Contribution from teaching staff = 1240 – 960 = Rs. 280
Contribution per head from teaching staff = 280/14 = Rs. 20
Now, this information can be tabulated as below
15. Discuss briefly the various sources of data.
View AnswerAns. There are two sources of Collection of data:
i. Primary source: Primary source of data implies Collection of data from its source of origin. It offers you first hand quantitative information relating to your statistical study.
ii. Secondary Source: It implies Collection of data from some agency or institution which already happens to have collected the data through statistical survey. It does not offer you first hand information relating to your statistical study. You are to rely on the information which is already existing.
16. From the following data, calculate coefficient of correlation between age and playing habits.
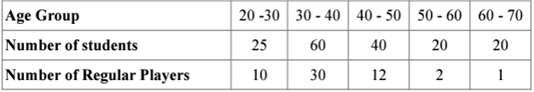
Ans. First, we are required to calculate the percentage of regular players.
Calculation of Percentage of Regular Players:
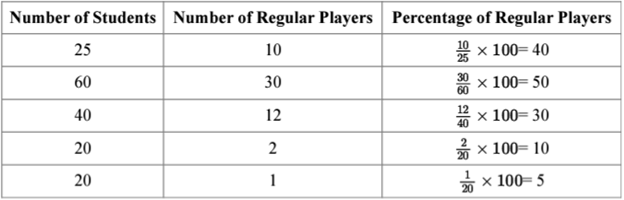
Denoting mid value of age as X and percentage of regular players as Y.
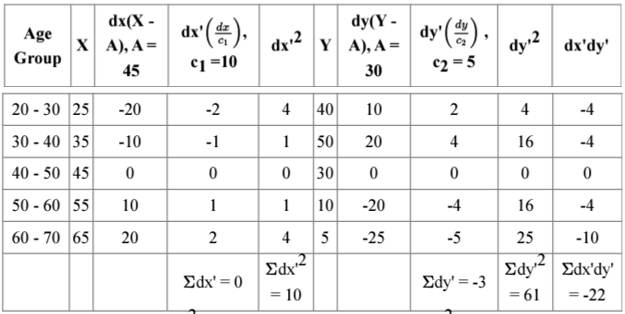
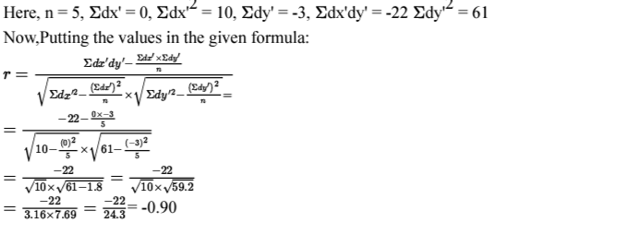
– Therefore, Karl Pearson’s coefficient of correlation between age and playing habits is -0.90.
– Interpretation of
1. It indicates that there is a high degree of negative correlation between age and playing habits.
2. It indicates that as age increases, the tendency to play decreases.
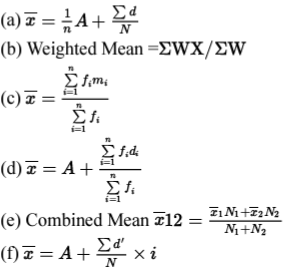
17. Give formula for:
a. Simple mean in individual series by short cut method
b. Weighted mean
c. Simple mean in continuous series by direct method
d. Simple mean in discrete series by short cut method
e. Combined Mean
f. Simple mean in continuous series by step deviation method
View AnswerAns.
OR
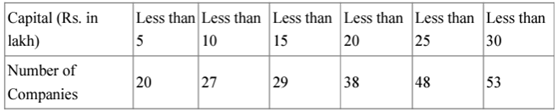
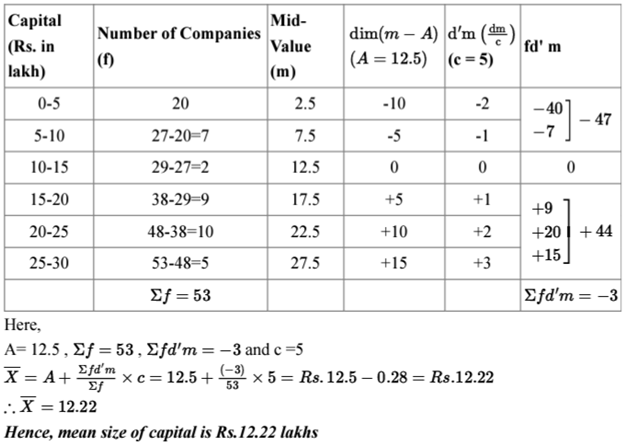
Following table gives the distribution of companies according to the size of capital. Using step deviation method, find out the mean size of the capital of a company.
Ans.
Section B
18. In case of increase in supply, we move:
a) from upper point to lower point of the supply curve
b) from lower point to upper point of the supply curve
c) to right on another supply curve
d) to left on another supply curve
View AnswerAns. c) to right on another supply curve
19. One of the characteristics of economic resource is scarcity. Which is the other?
a) They are not marketable
b) They are in abundance
c) They have alternate uses
d) They are available in limited quantity
View AnswerAns. c) They have alternate uses
20. Excess capacity is a prominent feature of equilibrium under?
a) Perfect competition
b) gopoly
c) Monopoly
d) Monopolistic competition
View AnswerAns. d) Monopolistic competition
21. The Total revenue become negative when
a) TR is constant and maximum
b) TR stops rising at increasing rate
c) Never
d) TR starts rising
View AnswerAns. c) Never
22. The average fixed cost at 4 units of output is ₹ 20. Average variable cost at 5 units of output is 40. Average cost of producing 5 units is:
a)₹ 60
b)₹ 56
c)₹ 20
d)₹ 40
View AnswerAns. a)₹ 60
23. Assertion (A): When the law of demand fails, the inverse relationship between price and quantity does not hold good.
Reason (R): The demand curve may slope upward showing higher purchases at a higher price.
a) Both A and R are true and R is the correct explanation of A.
b) Both A and R are true but R is not the correct explanation of A.
c) A is true but R is false.
d) A is false but R is true.
View AnswerAns. b) Both A and R are true but R is not the correct explanation of A.
24. Which of the following is a feature of perfect competition?
a) Homogeneous Units of the Product
b) Large Number of Buyers and Sellers
c) Perfect Knowledge of the Market
d) All of these
View AnswerAns. d) All of these
25. Can MR be zero or negative?
a) Both are not related
b) Both are related
c) Yes
d) No
View AnswerAns. c) Yes
26. Average fixed cost (AFC) is indicated by:
a) a rectangular hyperbola
b) a straight line parallel to X-axis
c) a U-shaped curve
d) a straight line parallel to Y-axis
View AnswerAns. a) a rectangular hyperbola
27. In case of perfect competition:
i. a firm is able to charge higher price
ii. a firm is able to charge uniform price
iii. a firm is able to sell any amount at the prevailing price
a) only i
b) Both ii and iii
c) only ii
d) only ii
View AnswerAns. b) Both ii and iii
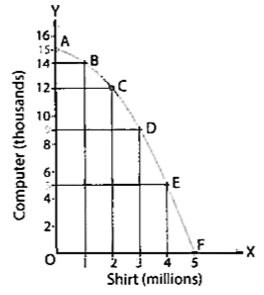
28. Draw PPC for an economy, if production possibilities are as under. Also find marginal opportunity cost.
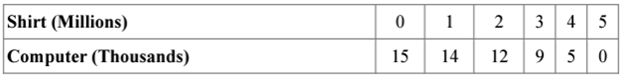
Ans.
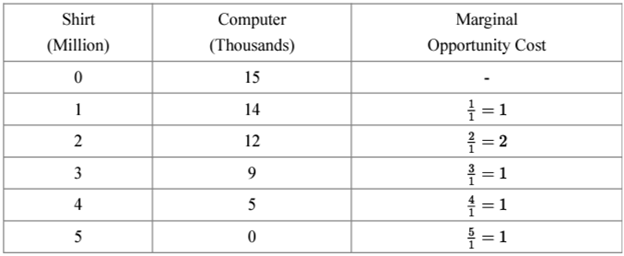
PPC is shown below:
OR
Classify the following statements into positive economics or normative economics, with suitable reasons:
a. Government should try to control the rising fiscal deficit.
View AnswerAns. Normative statement- it deals with a situation as it ‘What ought to be’.
b. Real Gross Domestic Product (GDP) is calculated on the basis of base year price.
View AnswerAns. Positive statement- it deals with a real life situation, justifiable by facts.
29. Explain ‘large number of buyers and sellers’ feature of perfectly competitive market.
View AnswerAns. A perfectly competitive market is dominated by a very large number of buyers and sellers of a commodity. This means that there is no such buyer who can influence the market price on its own by changing his individual demand. Further the number of sellers is so large that no individual firm owns the control over the market price of the commodity. Thus, firms have no role to play other than supplying the required output at the existing market price and therefore a firm is a price taker and not a price maker. Thus we can conclude that each buyer/seller in perfect competition has to accept the price as prevailing in the market.
30. Distinguish between Individual’s Demand and Market Demand. Name the factors affecting demand for a goods by an individual.
View AnswerAns. Individual Demand: It refers to the quantities of a particular commodity that a consumer is willing to purchase at different possible prices.
Market Demand: It refers to the aggregate (total) demand for all the consumers in the market at different prices. The factors affecting demand for a commodity are as follows:
i. Price of a given commodity,
ii. Price of other goods,
iii. Income of the consumer,
iv. Consumer’s tastes and preferences,
v. Expectation of change in the price in future.
31. As a producer, how would you adjust your level of output when MR and MC are not equal? Assume that, the price of your product is constant for you, and the law of variable proportions is operative.
View AnswerAns. Constant price means AR is constant. If AR is constant, AR = MR. Both AR and MR are, therefore, indicated by a horizontal straight line, parallel to X-axis. When the law of variable proportions is operative, the MC curve tends to be U-shaped. MC tends to decline corresponding to increasing returns, and it tends to rise corresponding to diminishing returns.
As a producer, I will strike my equilibrium at a point when:
(i) MR = MC, and (ii) MC is rising.
I may face two situations:
(i) MR > MC, and (ii) MR < MC.
For me, MR is constant in both situations so I will have to adjust my output. So the equality between MR and MC will be achieved only through changes in MC. In situation 1, when MR > MC:
I would like to increase the level of output. This would cause an increase in MC. The process of increasing output is to be continued till MR = MC. In situation 2, when MR < MC:
I would like to decrease the level of output. This would cause a decrease in MC. The process of decreasing output is to be continued till MR = MC.
OR
From the following table, find out the level of the output at which the producer will be in equilibrium. Give reasons for your answer.
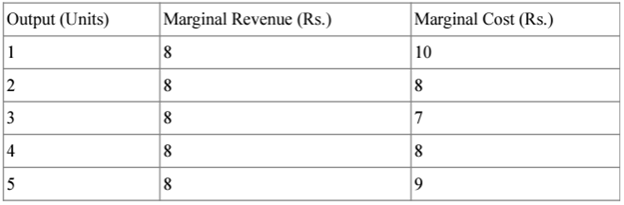
Ans. Producer’s Equilibrium: Equilibrium refers to a state of rest when no change is required. A firm (producer) is said to be in equilibrium when it has no inclination to expand or to contract its output. This state either reflects maximum profits or minimum losses. A producer strikes his equilibrium when two conditions are satisfied:
i. MR = MC, and
ii. MC is greater than MR after the MC = MR output level. MR = MC in two situations:
i. when 2 units of output are produced, and
ii. when 4 units of output are produced.
However, while in situation 1 (i.e. when output = 2 units) MC is falling, while in situation 2 (when output = 4 units) MC is rising. We know that a producer will strike his equilibrium only when MC is rising. Implying that the equilibrium will be struck when 4 units of output are produced, not then 2 units of output are produced.
32. A consumer consumes only two goods A and B and is in equilibrium. Show that when price of good B falls, demand for B rises. Answer this question with the help of utility analysis.
View AnswerAns. Let other things being constant, the consumer will be in equilibrium when MUA/PA= MUB/PB
Now, suppose price of good B, i.e., PB falls. The situation changes. The consumer is no longer on equality with respective prices of the two goods PA and PB. Other things remain in equilibrium, the above equality turns into an inequality : MUA/PA> MUB/PB
It means that per rupee MU from consumption of B is greater than the consumption of A. This induce the consumer to buy more of B and less of A. The consumer transfers expenditure from A to B.
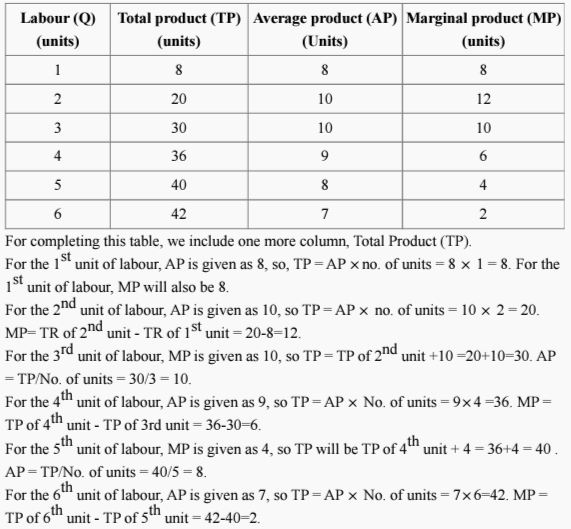
33. Complete the following data.
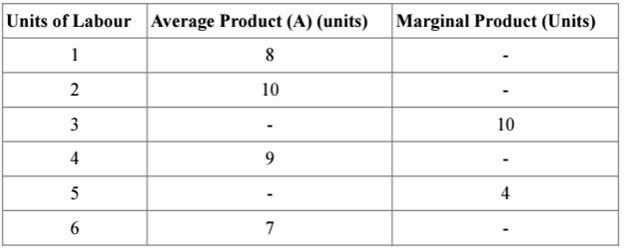
Ans.
34. Answer the following questions
(i) The measure of price elasticity of demand of a normal goods carries minus sign while price elasticity of supply carries plus sign. Explain why?
View AnswerAns. It is true that measure of price elasticity of demand for a normal goods carrier minus sign because there is an inverse relationship between Price and Quantity. Whereas, there is a positive relationship between price and quantity supplied. Therefore, price elasticity of supply carries plus sign.
(ii) A commodity showing high elasticity of demand often has a large number of close substitutes in the market. Do you agree?
View AnswerAns. Yes, we agree with the given statement. The elasticity of demand is high in the case of goods with close substitutes (for example, tea has its substitute in coffee). The availability of close substitutes makes it possible for the consumer to switch from one commodity (like tea) to the other (like coffee) in response to a change in the relative price structure. Accordingly, the elasticity of demand is high.